An editable Excel dashboard for restaurant groups with 2 to 10 locations. Enter one row per location per week (all 52 weeks of 2027 are pre-built) and the Dashboard ranks locations, compares each with last year and its own targets in red, amber and green, totals the portfolio and charts the trends. Pick the period, week and location from dropdowns. A short guide covers definitions, targets and a 30-minute weekly GM call.
- Editable Excel workbook (works in Google Sheets)
- Weekly data entry for up to 10 locations x 52 weeks (2027): net sales, same week LY, covers, labor %, F&B cost %, marketing spend, reviews and rating, guest list sign-ups, events booked
- Dashboard: location comparison, sales and growth rankings, vs LY and vs target with red/amber/green, portfolio totals
- Period selector (week, last 4 weeks, year to date), week selector and location dropdown
- Trend charts for the selected location and the whole portfolio
Editable Excel workbook + 8-page PDF guide. Instant download.

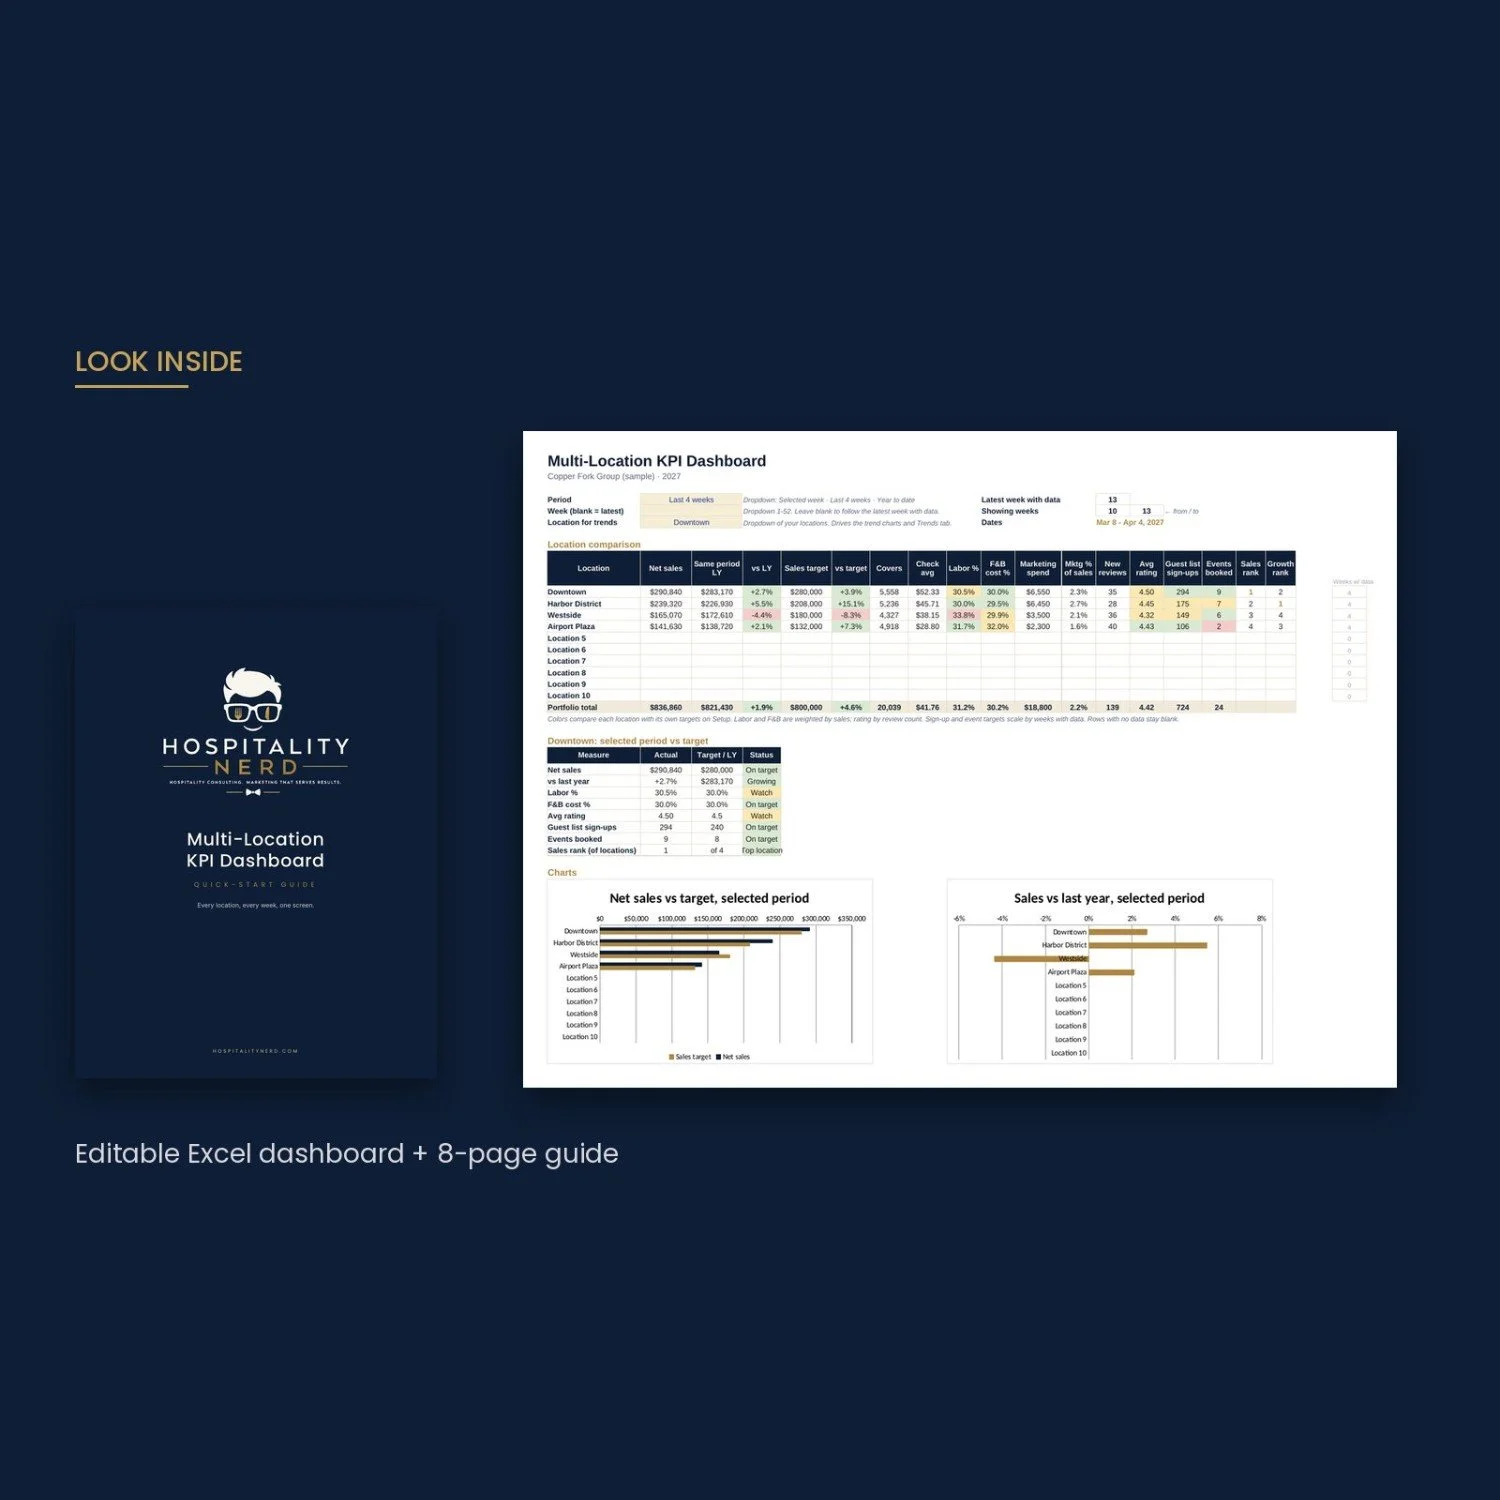 Image 1 of 6
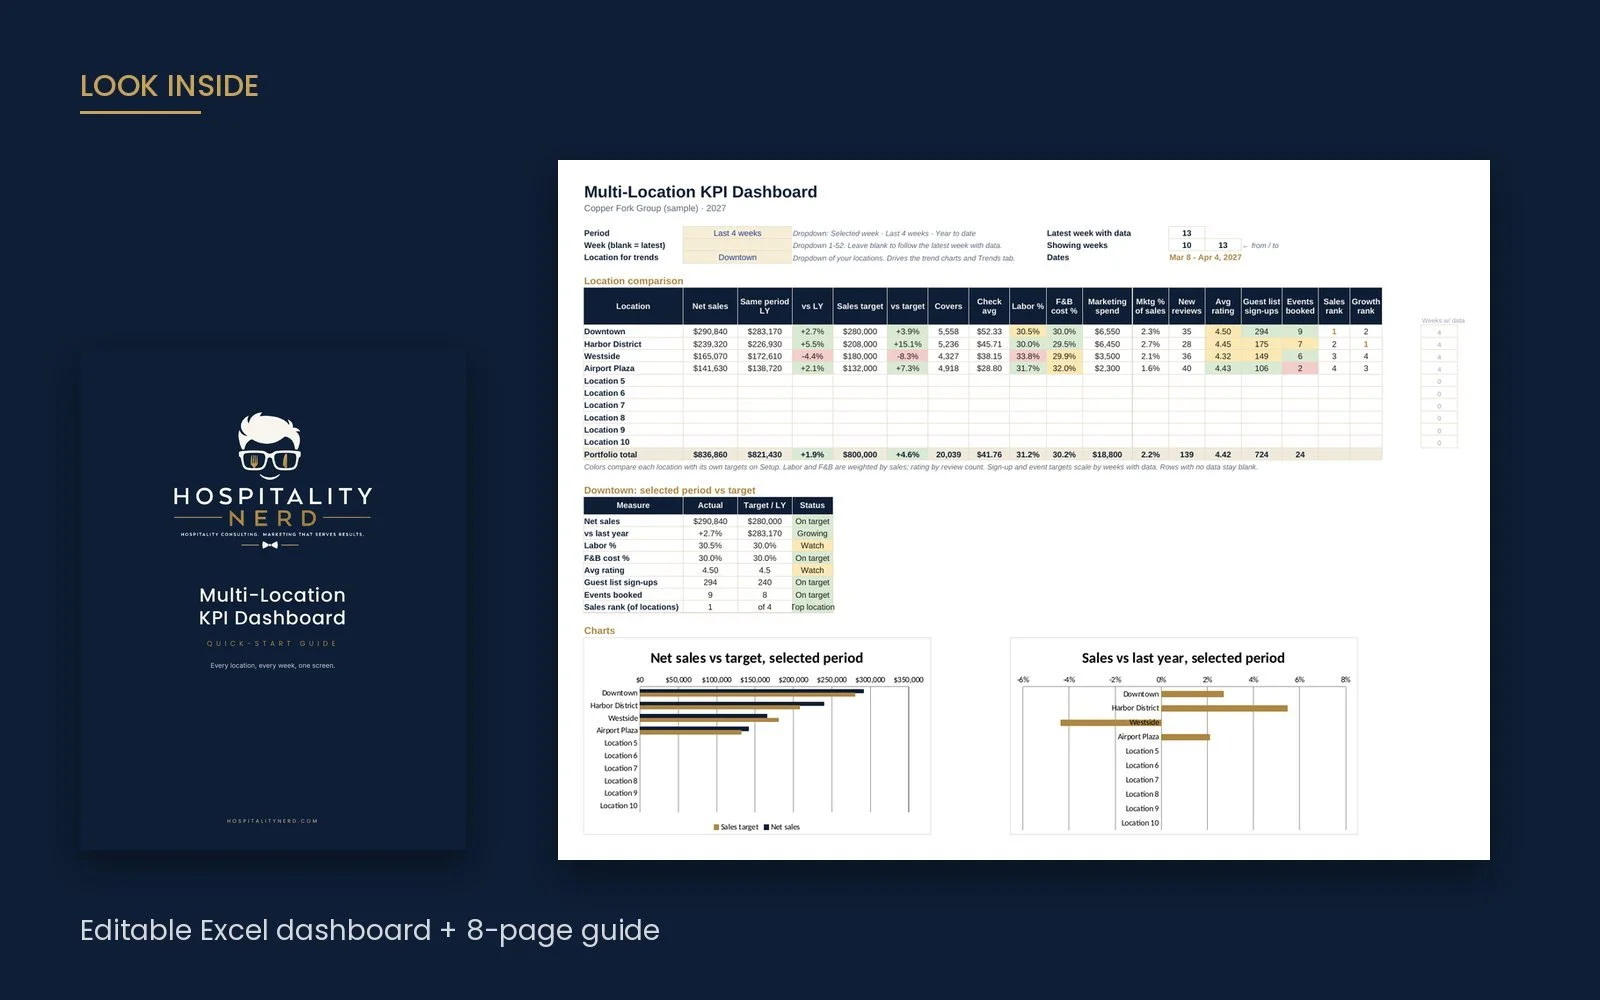 Image 2 of 6
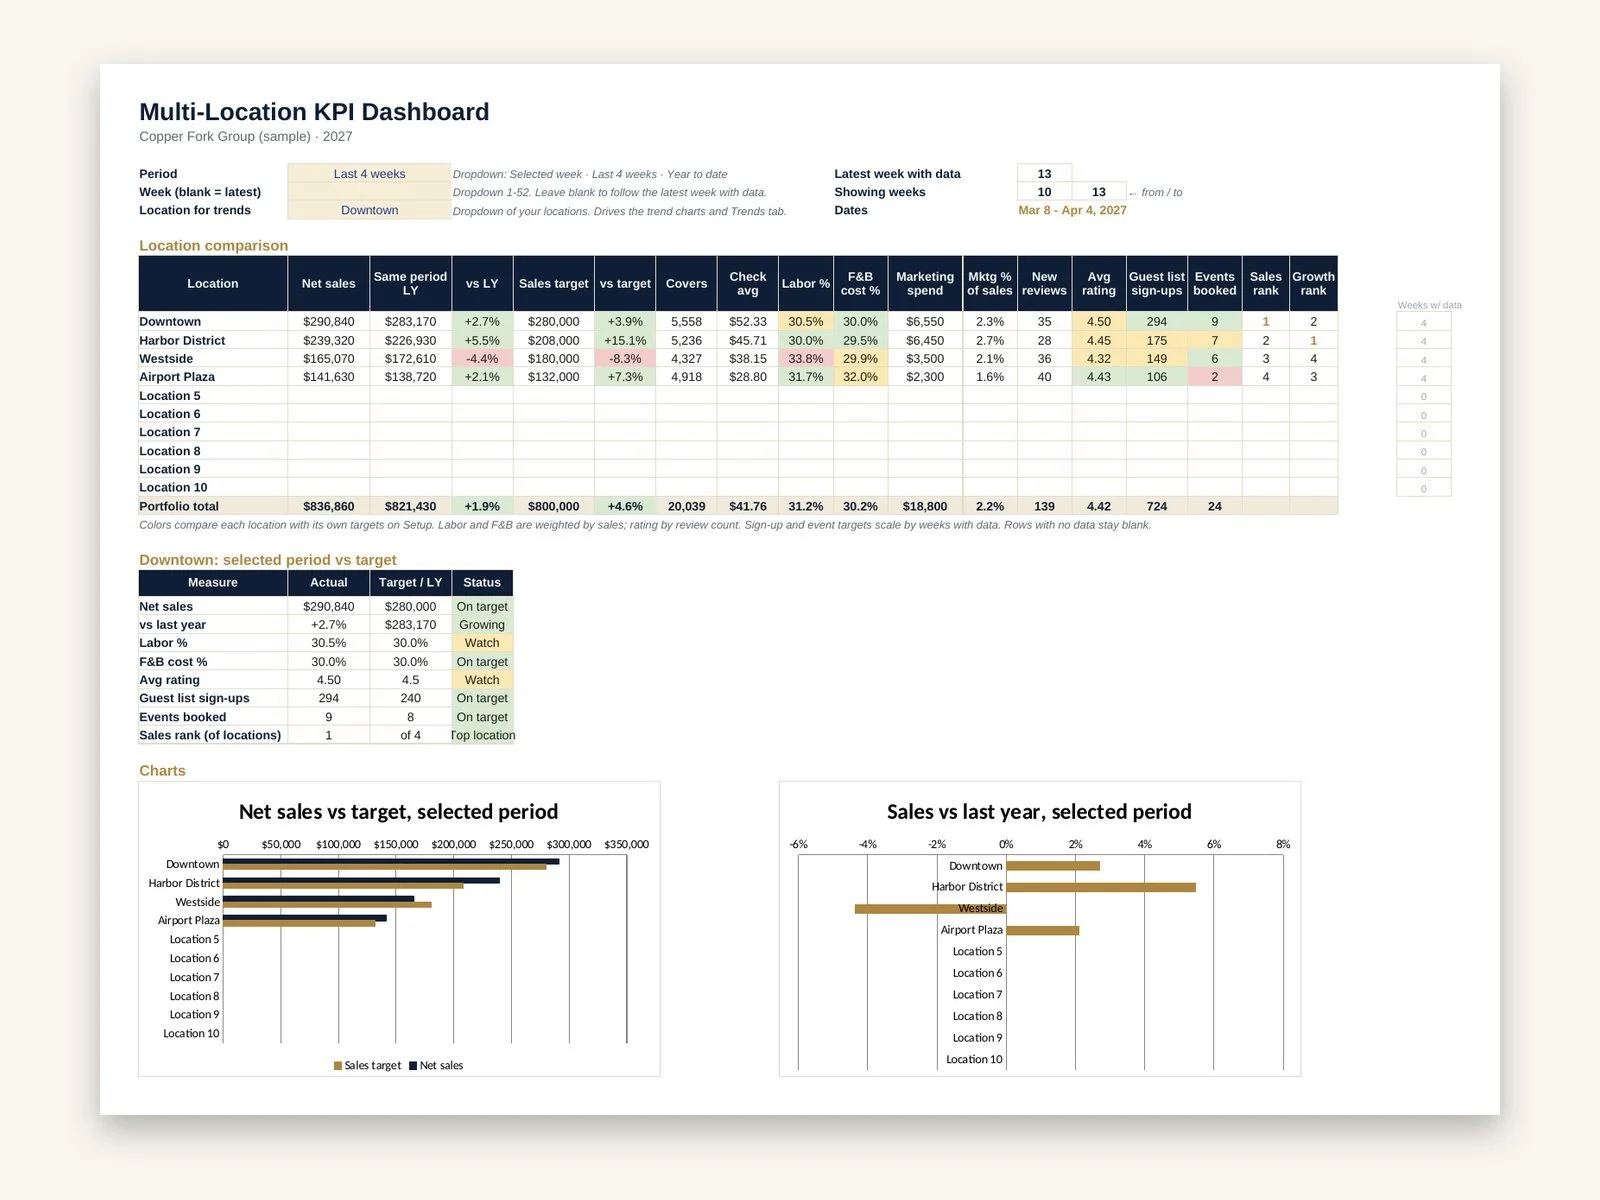 Image 3 of 6
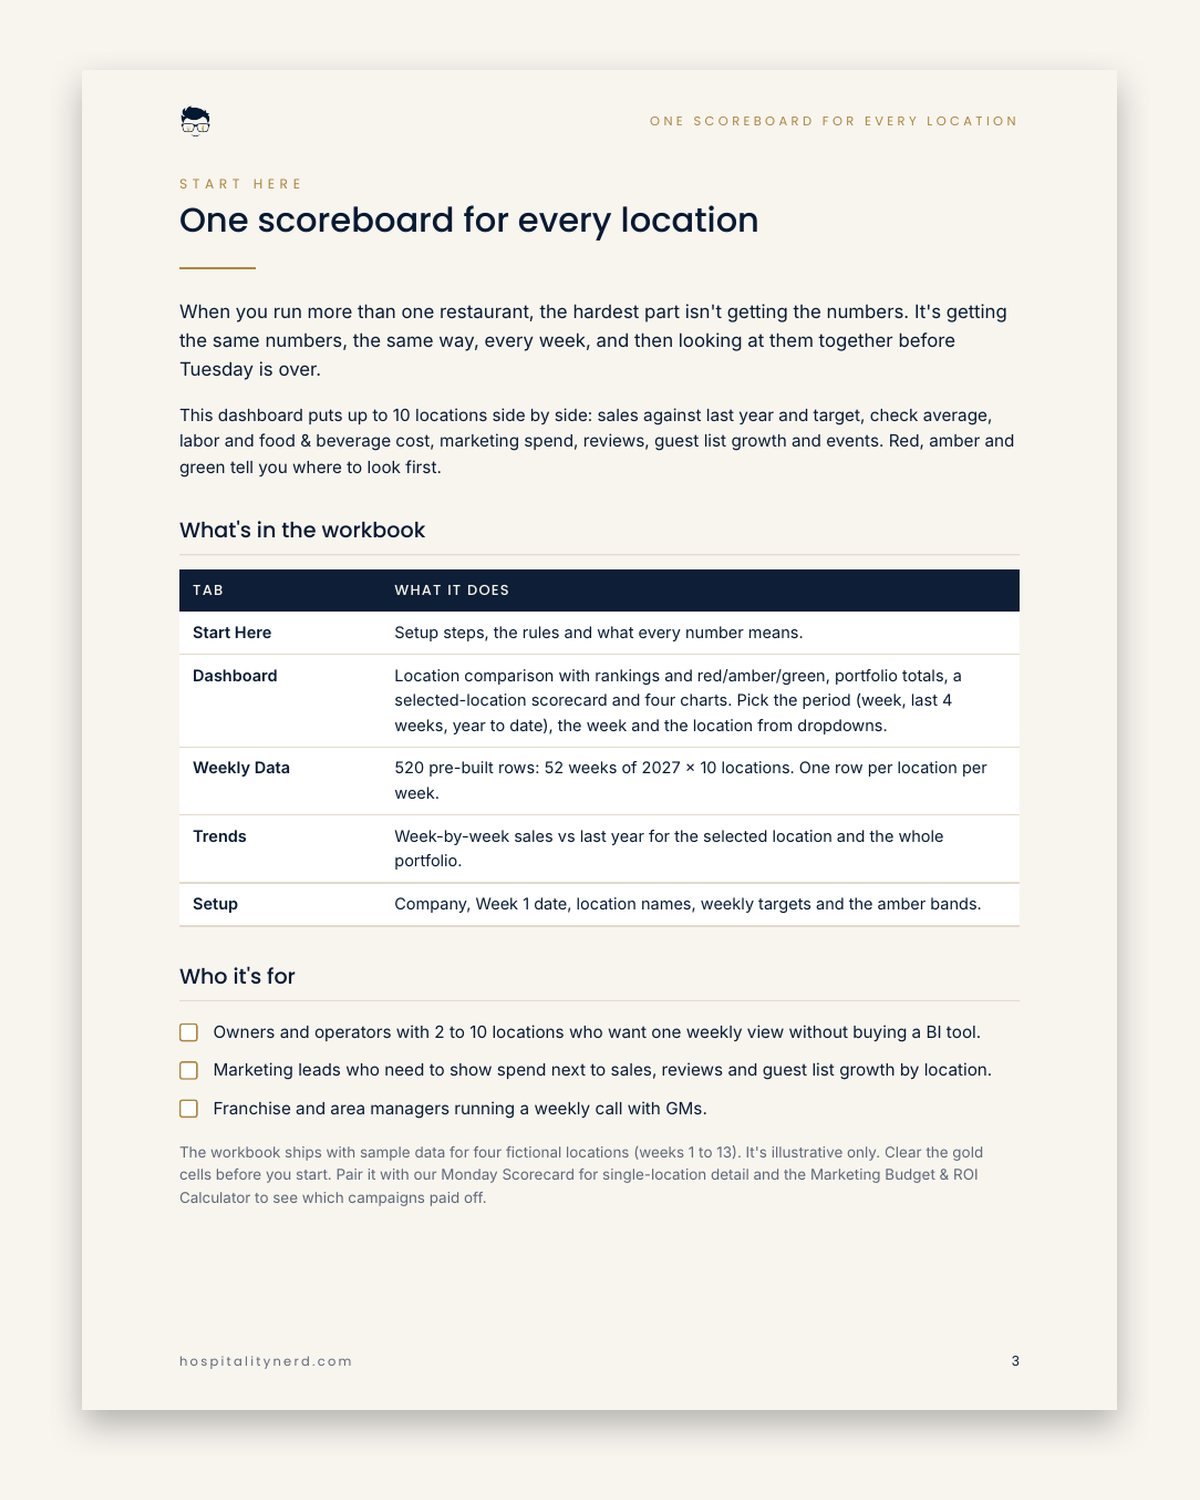 Image 4 of 6
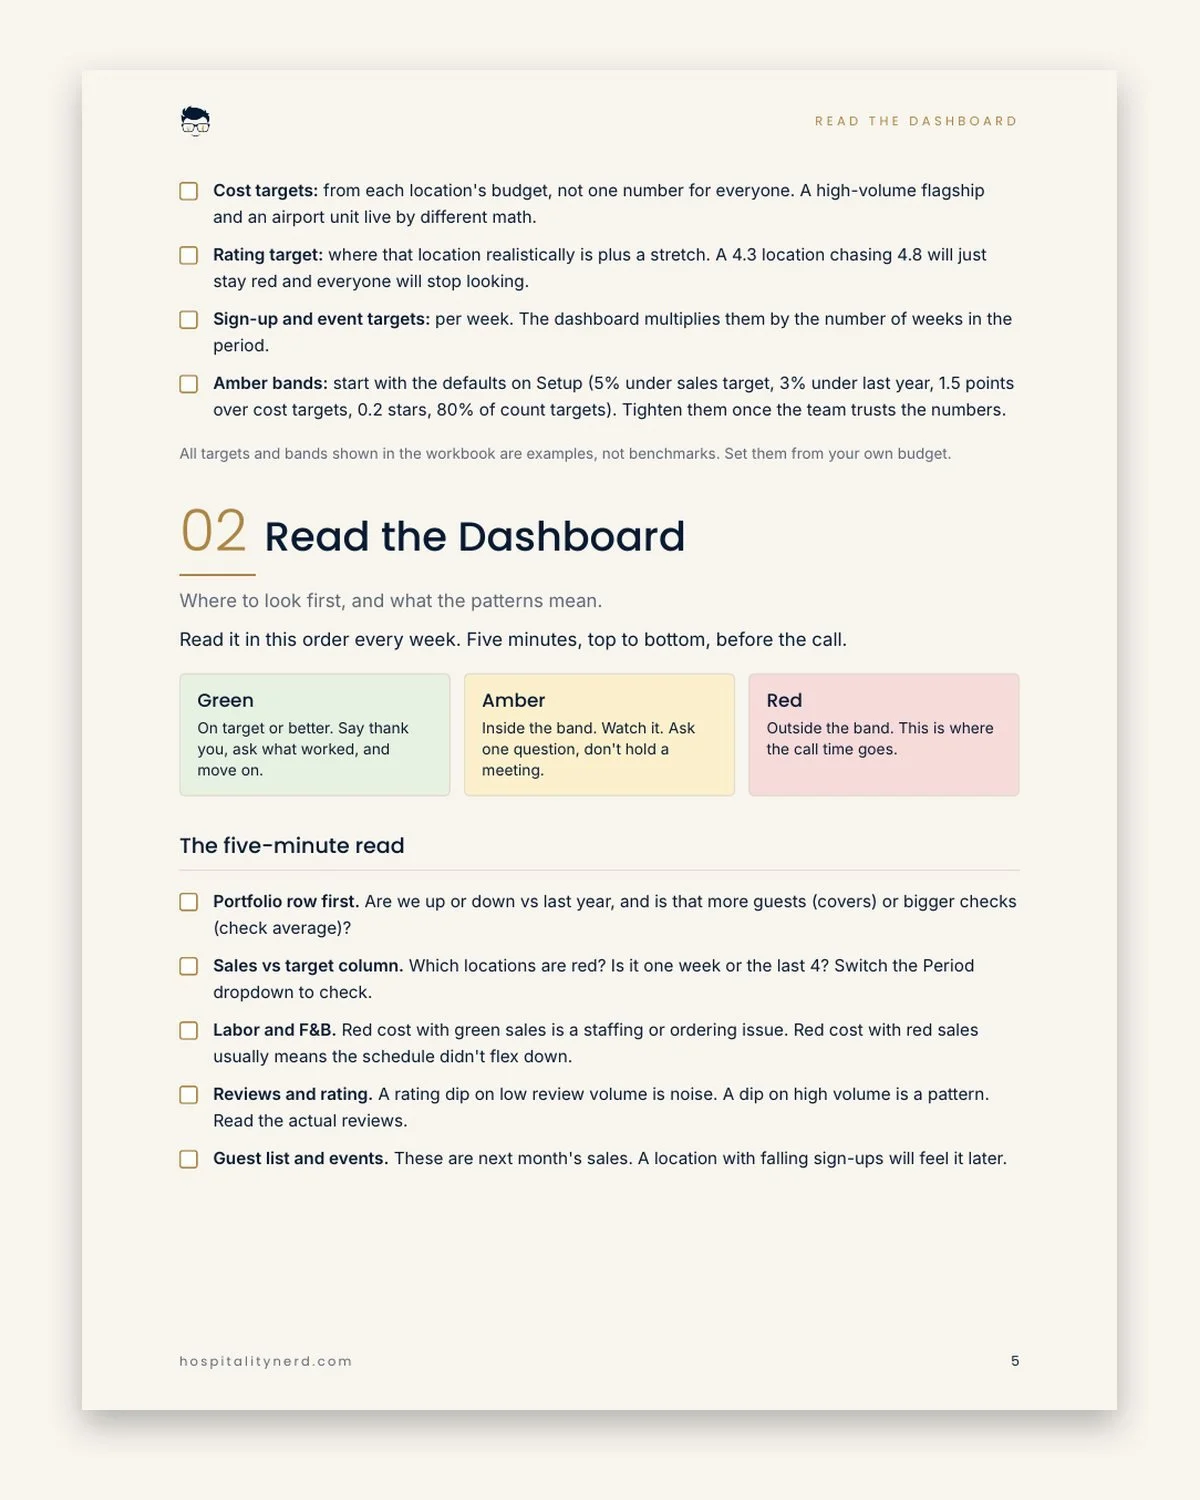 Image 5 of 6
 Image 6 of 6